Dear reader – if you even exist and aren’t an ad-bot. I have been on an over long sick leave. That’s the reason why I haven’t published any new posts, especially almost right away after the start. So this is not the typical “Hey I have a blog, please check this out!!1” and after a couple of posts and hardly any visitors: “but it’s so hard to publish new stuff and all this actually takes a lot of time, so let’s just let the time fade all this away” -explanation.. Well, readers or no, I think it’s good to at least to try to tell what I do and how and why – in an understandable and dense way. These are challenges, so training is for good. And sharing is caring: At least I have gotten ideas from conferenses, scientific articles and just googling things.. #paybacktime
What could be a better motivator to publish a new post than money? Many other, to be honest. But I just paid an extra year for this domain so publishing gives some instant value for the “investment”. One more specific reason could be a colleague who asked me if I still have my GLUE thing. Yes I have, but like too many times before, it was not documented properly. If at all. I know especially now that documenting (and having a specific place for them) is vital if the purpose is to use them later. A blog then? 🙂 I haven’t been doing anything hydraulic modelling related lately, so please let me tell something old stuff while updating the laptop, getting familiar with the keyboard and working routines and remembering too many forgotten passwords.. I suppose I never emphasized properly (or enough) why GLUE method is so good. I still think it’s a very good way to make your modelling and results even better. I’ll use my old “Ice-GLUE” as an example. I wrote another post about this some time ago.
I don’t know if I ever realized GLUE (generalised likelihood uncertainty estiation) method correctly and there is still plenty to learn for sure, but I became a fan of it already when I did my master thesis. Not applying the method then as the plan for the thesis was already made, but it would definitely have been a great help and make the results even better (well it was good enough if you ask reviewers and the 2008 version of me 🙂 Link to the abstract of the master thesis). I have this book about GLUE and I can recommend it if you want to learn more – and numerous scientific articles. At least I’m not the only one liking it.
So how does my version of GLUE and the first ever (and still the best) hydraulic model for me, HEC-RAS, work together then? I personally named that as GLUE-RAS..
- You don’t have to have a fully calibrated hydraulic river model. But unfortunately, as this isn’t a miracle doing everything for the user, it should be measured well and be able to produce good results. As the values can and will for example change with the decreasing and increasing discharge, downstream water elevation and growing and diminishing roughness factors (aquatic plants, landslides to river etc.) so it’s luckily useless to try to be perfect here. Pay attention observations and measurements have a good quality. Always.
- Try to think what kind of ranges the most important and/or meaningful physical quantities can have. In this current version you must give a minimum and a maximum value. Try to be realistic, remembering that the world can give surprises too. In a river and in a real life.. For a river with ice jam possibilities I thought these are important:
- Manning n values for the channel and left and right over banks (LOB, ROB). I see I had added an option to use the actual Manning n values or then a partition or multiplier of the original geometry n-values. I have never used that, though.
- Ice thickness. Meaning the thickness of ice before any ice jams. In here you can have only one ice thickness for the whole river, but that value can be extended to overbanks or then they are zero.
- Ice cover Manning values. What is the roughness of the ice cover? Again, like with ice thickness the same value is applied overall the river.
- Ice friction angle
- Ice porosity
- Ice stress K1 ratio
- The maximum underice velocity
- If there is an ice jam, what the manning n value of it?
- What is the range of the discharge coming in into the river? Only one channel to have an input discharge. A good programmer could extend this to multiple incoming flows
- What is the range of water elevation at the downstream of the model? This tool only have one place to where all the water in the model flows to.
- The lowest cross section of the ice jam.
- The length of the ice jam.
Naturally or surprisingly these are the things you can change/modify when doing your model geometry too.
- How many plans you want to make? Keep in mind there can be 1-99 calculations per one HEC-RAS plan..
- Number of decimals. Is almost always not more than 3, but for some reason I allowed something else too. I haven’t tried this.
- Number of projects. A normal full HEC-RAS project has got 99 plans, so 10 full projects is almost 1000 results. Take care of hard disk space and time you are allowed to use..

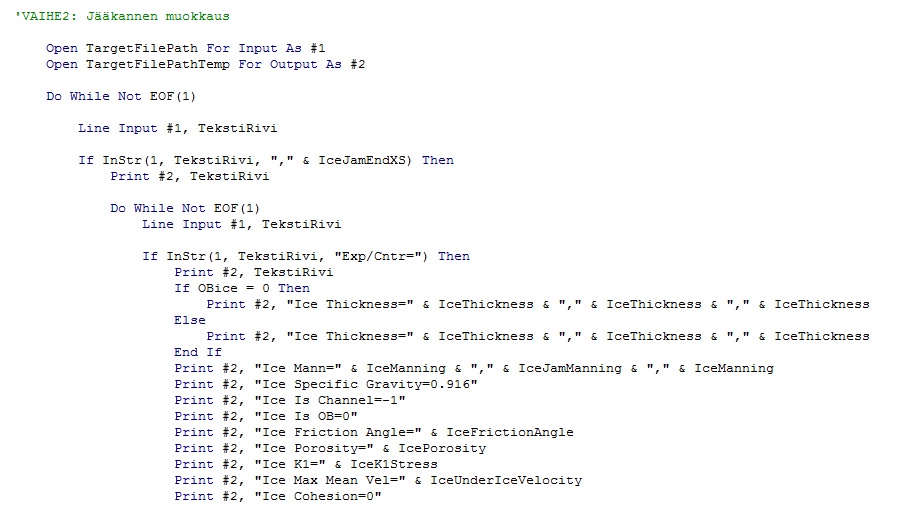
So what does this do then? Basically this is like a random number generator, taking those before mentioned quantities and giving them new values from the given range. I used Excel and its VBA (Visual Basic for Application) programming language. In short, it generates numerous HEC-RAS project plans differing a bit from each other but which still are inside the range you just have defined in the Excel form. Please check out this book too for “real” way to break the HEC-RAS code. I just didn’t get everything working – and it’s not book’s and model’s fault.

Maybe one possibility to make an improvement could be to give a user a possibility to use some kind of distribution (like normal distribution?) instead the basic uniform distribution. Another improvement could be to define which one of these are going to randomised and which one not. Well, if you now give the same mimimum and maximum value, it should always generate a one and wanted value as a “random” value.
To be honest, I have never tried the flow change location. Or at least I don’t remember it (that can happen). For some reason I added that fuction anyway. Maybe if there are river junctions and the discharge is divided – but you don’t have the geometry of the whole river for example.. You could give a location and the amount of percentage of the discharge to get removed from the model?
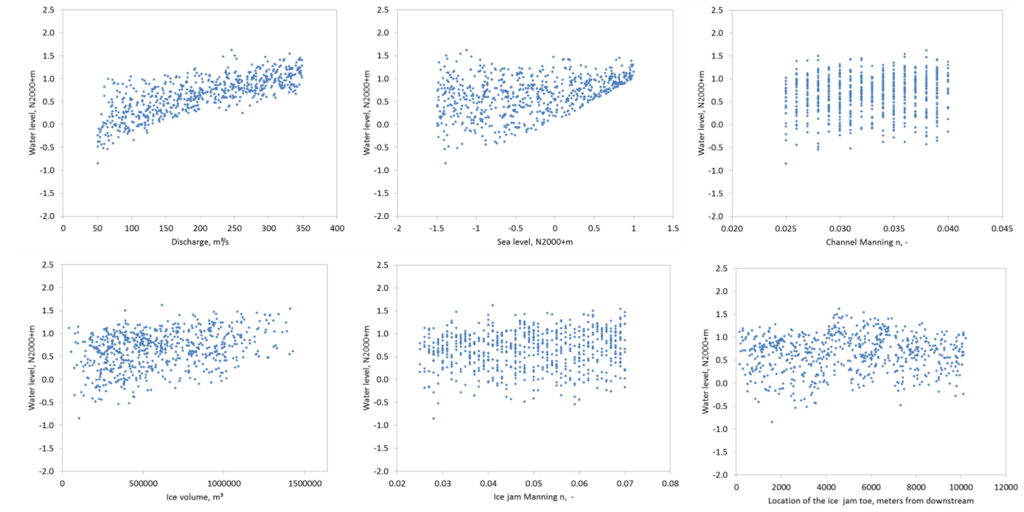
Then you just run the large amount of HEC-RAS projects and get the results. You get lots of result files. A good programmer would automatize this more to get the results automatically to Excel, but I’m not a good one 🙂 Anyway, having these point clouds you might get a better idea or proofs that some things you have defined (discharge, downstream water elevation, ice jam location, amount of ice etc.) in the area are really meaningful or some are totally meaningless. Or things you thought are meaningless are still meaningful if other things and stars have the right value or position.

A good text always summarizes the key point.. Err.. Well a note to self says anyway:
- Document what you do, as you or somebody else might need the information later..
- Hello internet! I’m (trying to be) back.
- I noticed there is one draft (in Finnish) from the past in this blog when I finally got logged in, so stay tuned – I try to be a bit quicker (don’t count your chickens before they hatch though, Juha)
- As the computation efficiency of the modern computers is so good, I really wonder what is the reason to not use this kind of method in problem solving
- Knowing uncertainty can eventually bring more certainty?


